Monitor dbt test results
When you connect dbt Cloud or dbt Core, Matia creates a dbt monitor for every test in your dbt project. Each monitor tracks the test's results over time, and a failed test opens an issue alongside the rest of your observability alerts. This guide explains how dbt test monitors are created, where to find them, and how to read their results. For concepts, see How monitors work and Monitor types.
Prerequisites
Connect dbt to Matia. See the dbt Cloud setup guide or the dbt Core setup guide.
How dbt Test Monitors Are Created
- Matia reads the tests defined in your dbt project.
- Matia creates one monitor per test. The monitor uses the test's name (for example,
uniqueornot_null) and is attached to the model the test runs against. - Each time the test runs in dbt, Matia records the result in the monitor's history.
- If a test fails, the monitor moves to Alerting and Matia opens an issue.
Tests still run in dbt, not in Matia. Matia only reads the results. To change a test, update it in your dbt project.
Matia supports the following test types:
- Generic tests: tests defined in YAML, such as
unique,not_null,accepted_values, andrelationships. - Singular tests: SQL files in your project's
testsfolder. - Unit tests: tests that validate a model's logic against sample data.
Find dbt Test Monitors
- Go to Observability in the left sidebar.
- In Monitors Details, click Add Filter and select Monitor Type.
- Select dbt and click Apply.
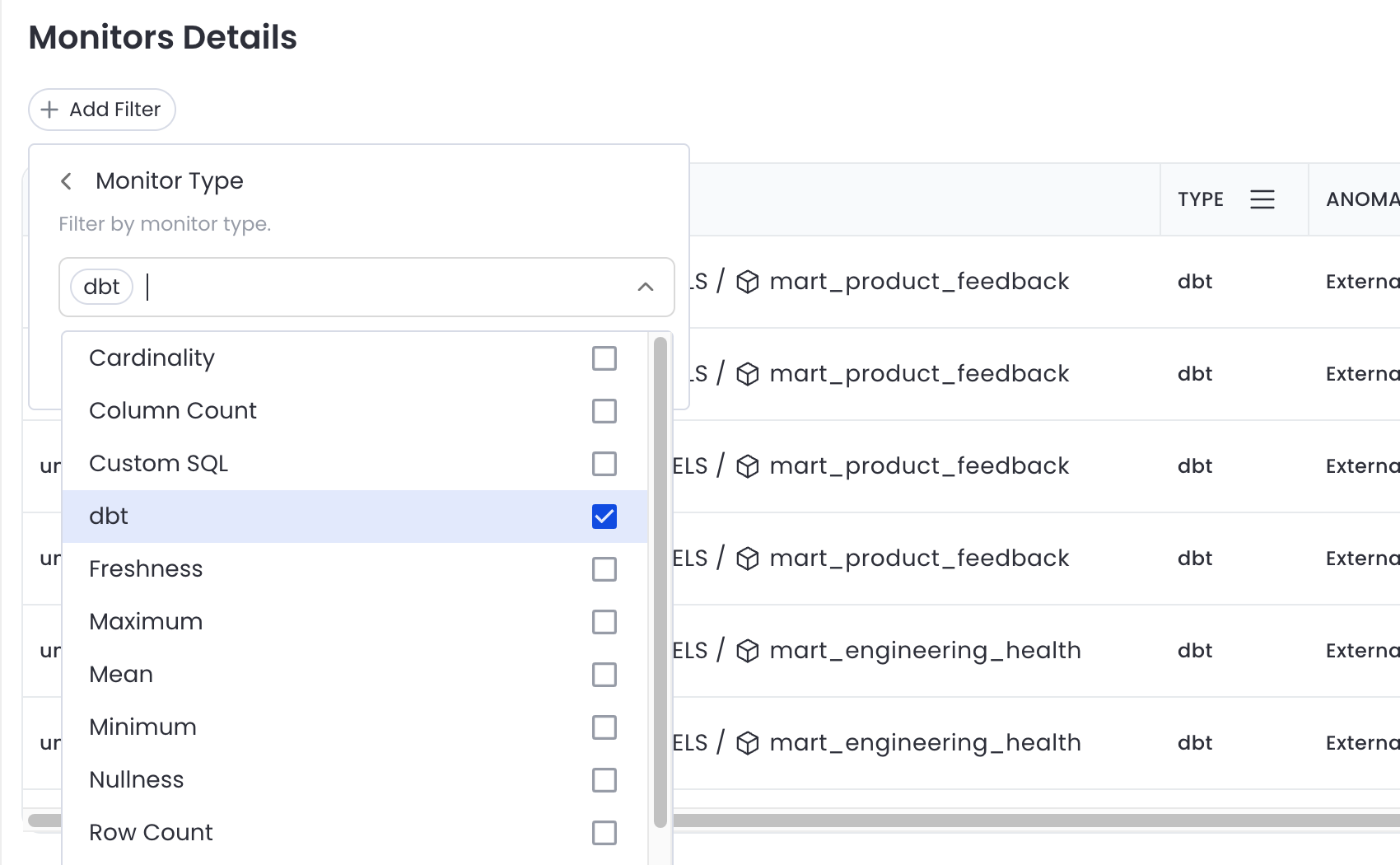
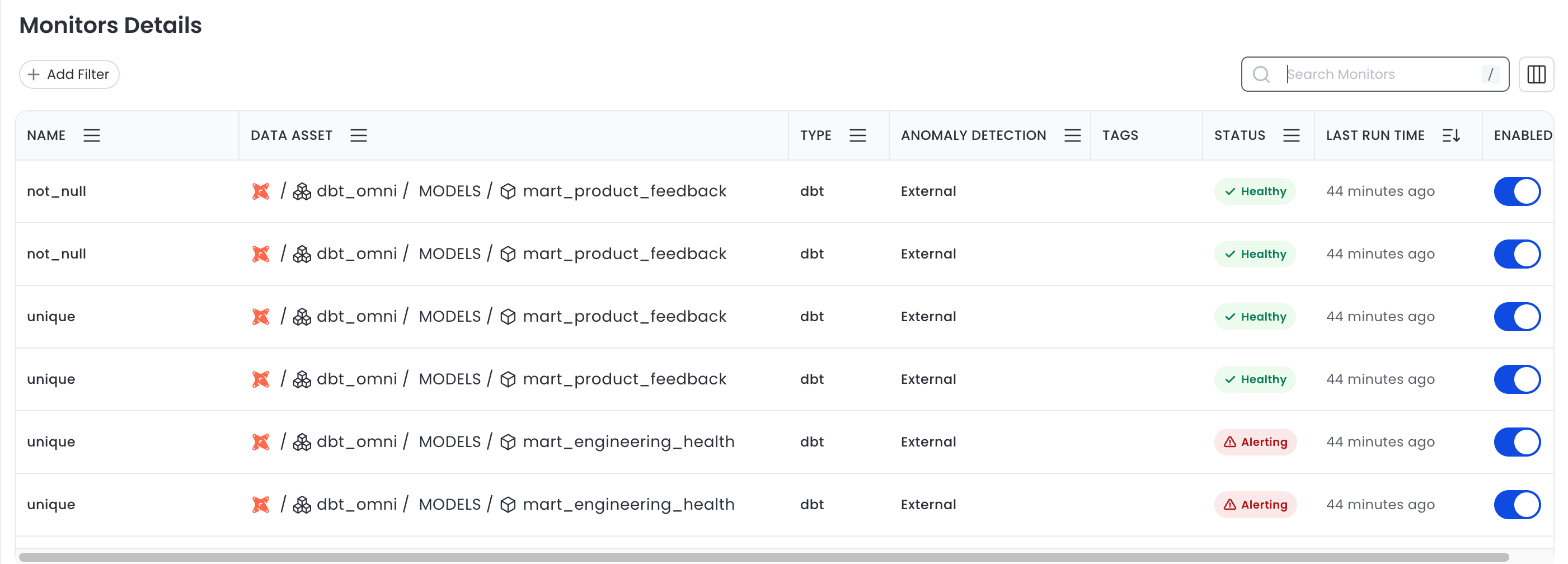
The table shows each dbt monitor with its data asset, status, and last run time. dbt monitors show dbt in the Type column and External in the Anomaly Detection column, since pass/fail is decided by dbt.
View Test Results
Click a monitor to open its Status tab.
- Overview charts the test result over the selected time range.
- Queries lists each test run with the Observed time, the returned Value, the Expected value, and the dbt Test Result (Pass or Fail).
- Monitor Details shows the database, schema, table, and column the test covers, plus the dbt Test name, Test type, and Last test run. Scroll down to see the Test Params and the Test Query, which you can switch between raw and compiled SQL.
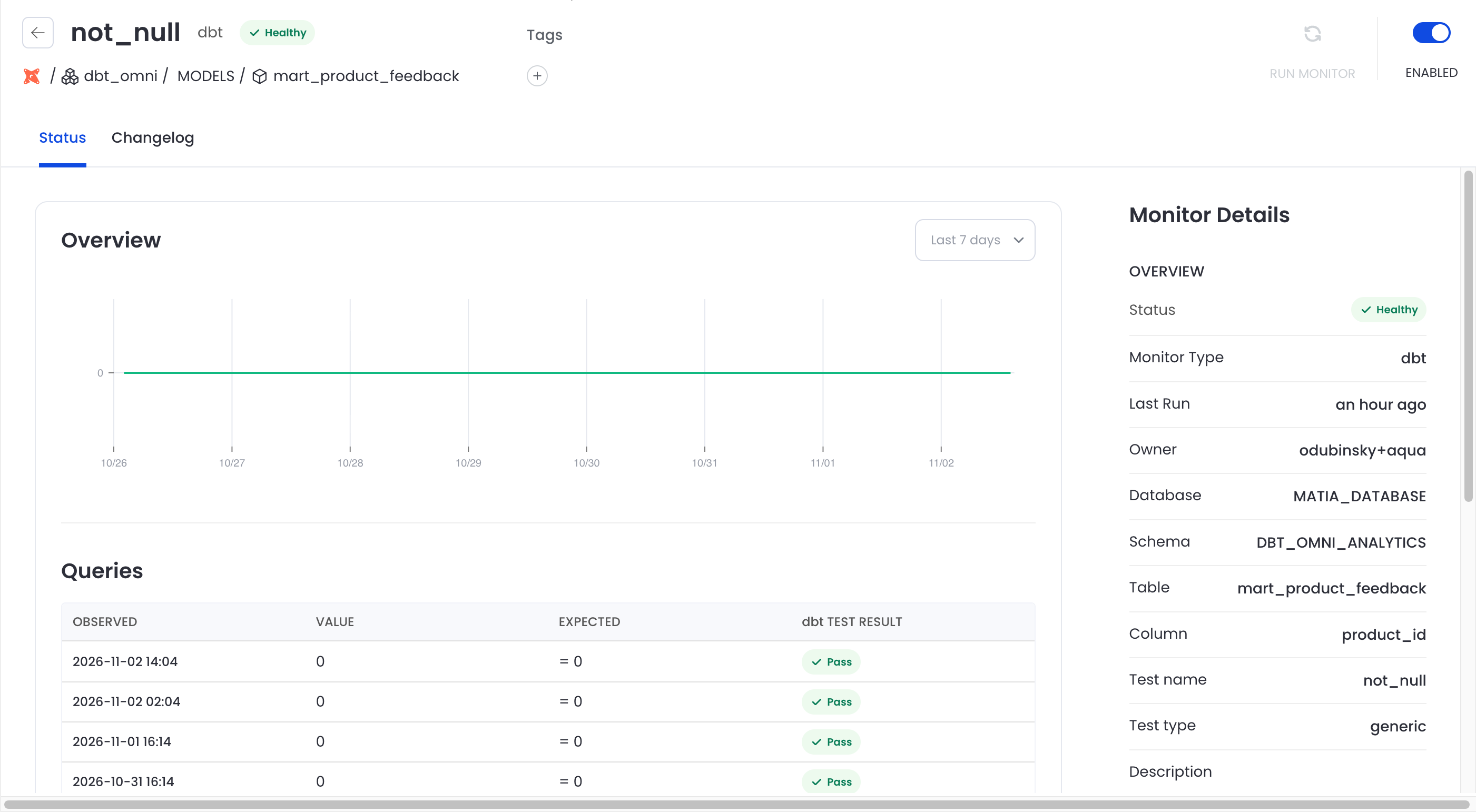
You can still add Tags to a dbt monitor and turn it on or off with the Enabled toggle.
Handle Failed Tests
When a test fails, the monitor status changes to Alerting and a banner shows that the monitor has an ongoing issue. Click Link To Issue to open it.
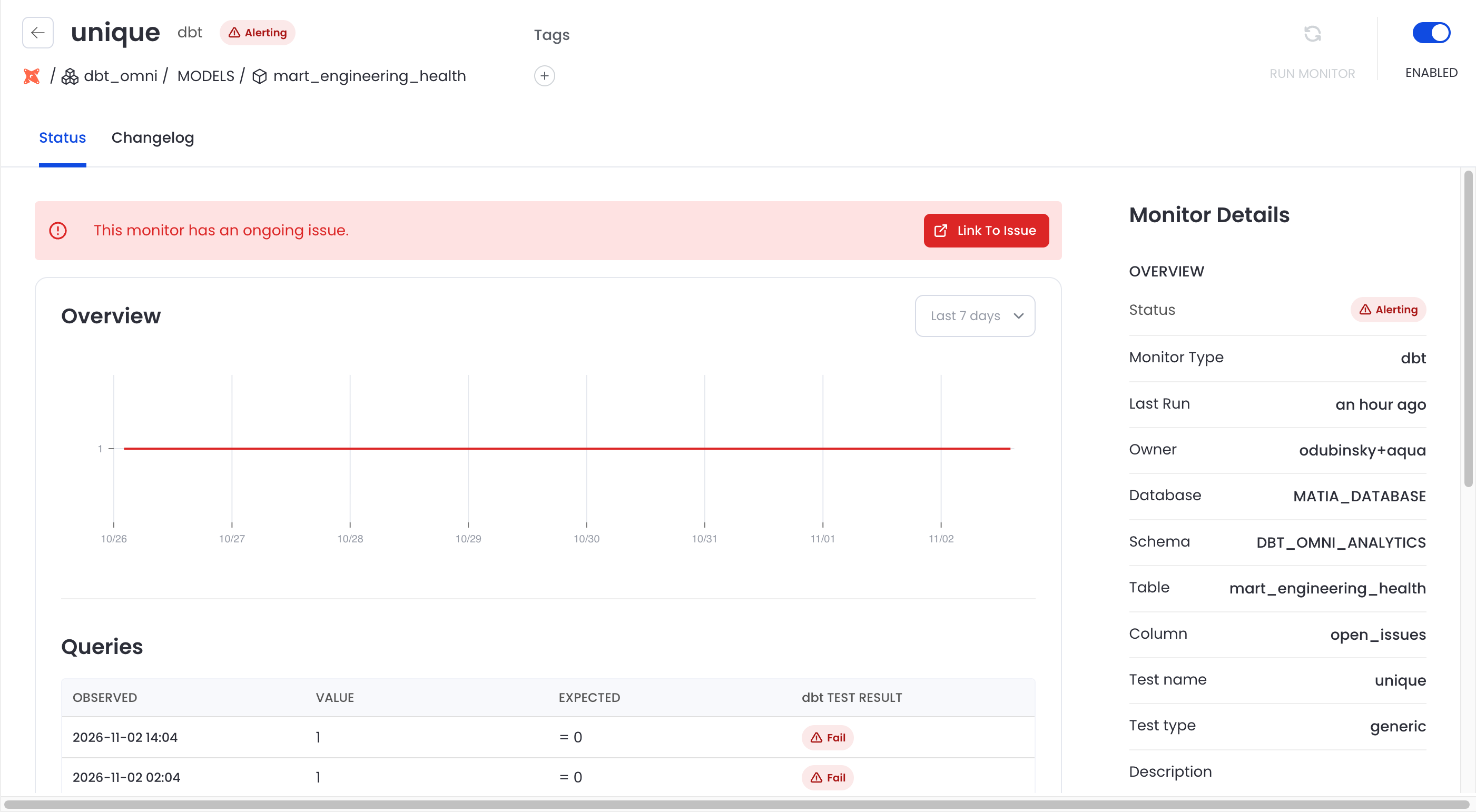
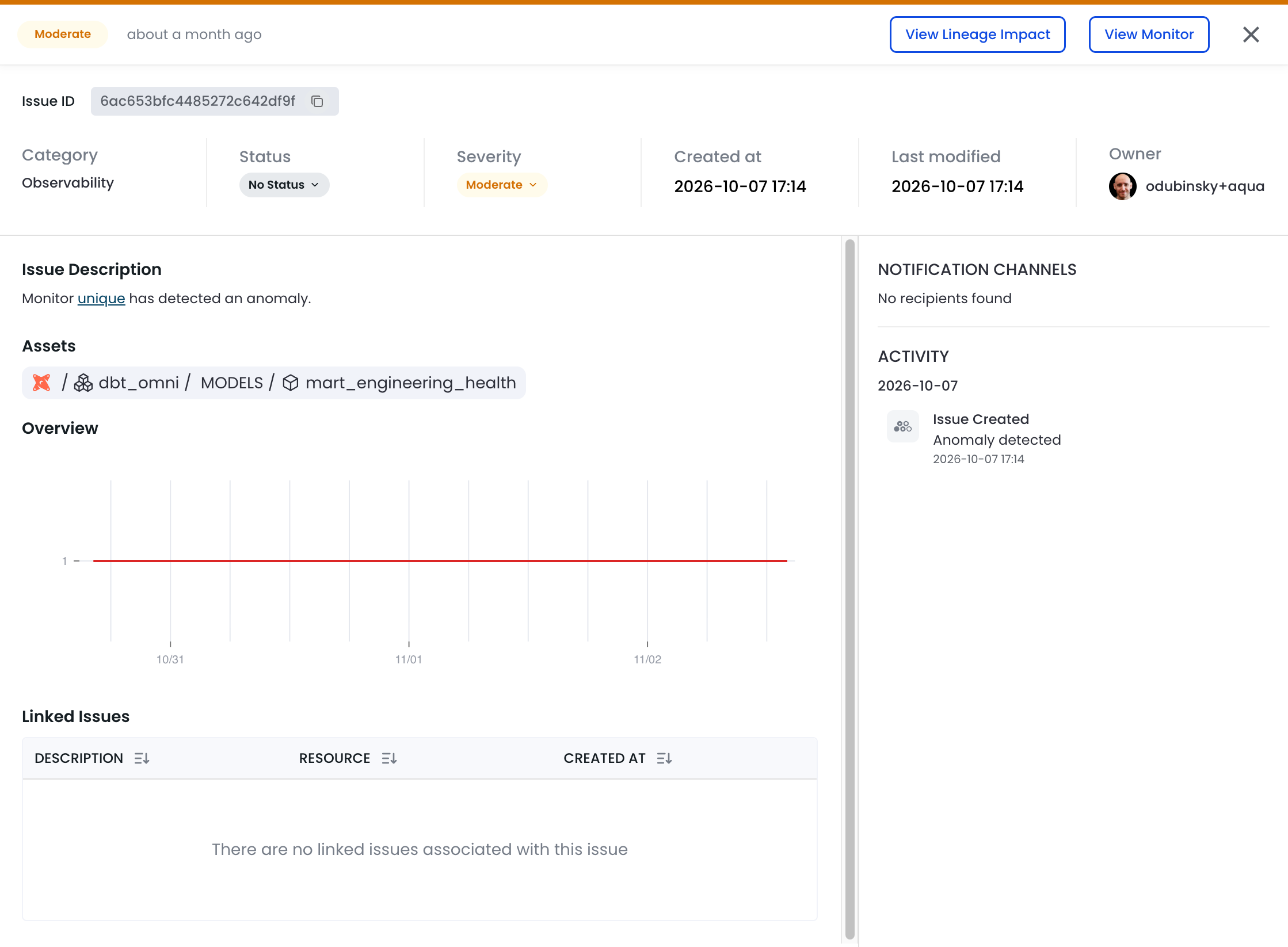
The issue shows the affected asset, the result history, and its activity. From the issue, click View Monitor to return to the test results, or View Lineage Impact to see which downstream assets depend on the failing model.
To control who is notified when a dbt test fails, see Configure alert routing for monitors.